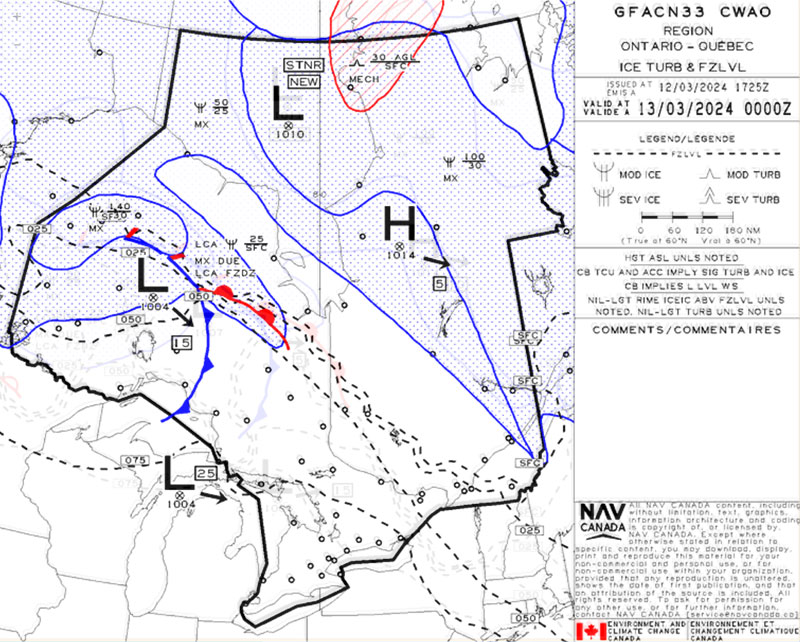
GFA – Icing, Turbulence and Freezing Level Chart
The graphic area forecast (GFA) icing, turbulence and freezing level chart depicts forecast areas of icing and turbulence as well as the expected freezing level at a specific time. Included on the chart are the type, intensity, bases and tops of each icing and turbulence area. Surface synoptic features such as fronts and pressure centres are also shown. This chart is to be used in conjunction with the associated GFA clouds and weather chart issued for the same period of validity.
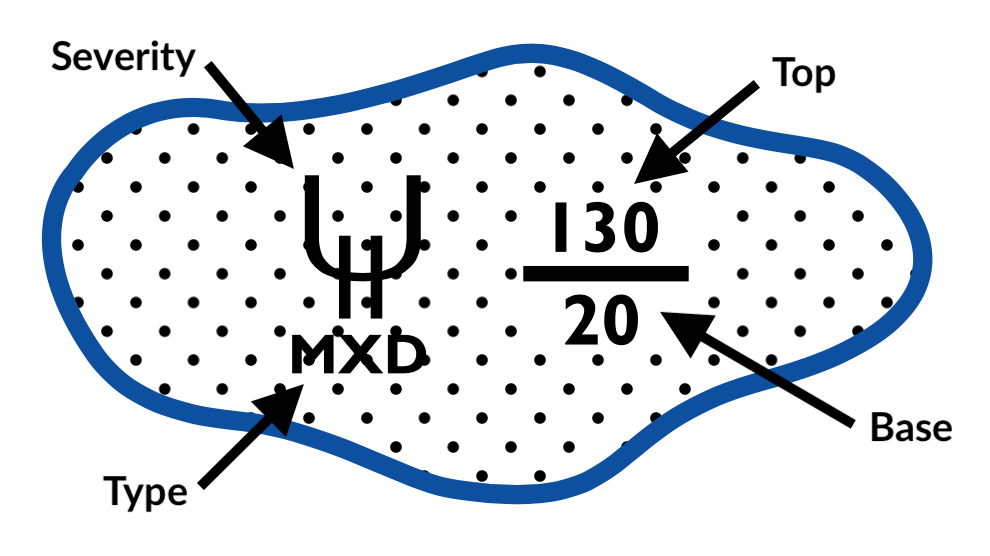
Icing is depicted in blue whenever moderate ![]() or severe
or severe ![]() icing is forecast for the coverage area. The base, tops and type of icing associated with each icing layer is reported in hundreds of feet above mean sea level. Areas of light icing are described in the comments box.
icing is forecast for the coverage area. The base, tops and type of icing associated with each icing layer is reported in hundreds of feet above mean sea level. Areas of light icing are described in the comments box.
An area of moderate mixed icing based at 2,000 feet ASL with a top of 13,000 feet ASL would be depicted on a GFA as shown below:
Freezing Level
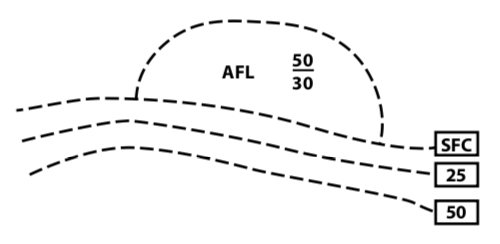
Freezing level contours are indicated by dashed lines. The height of the freezing level is indicated to the nearest multiple of 2,500 feet. When more than one freezing level is forecast, only the lowest level needs to be indicated, unless meteorological conditions are expected to be relevant to aviation safety.
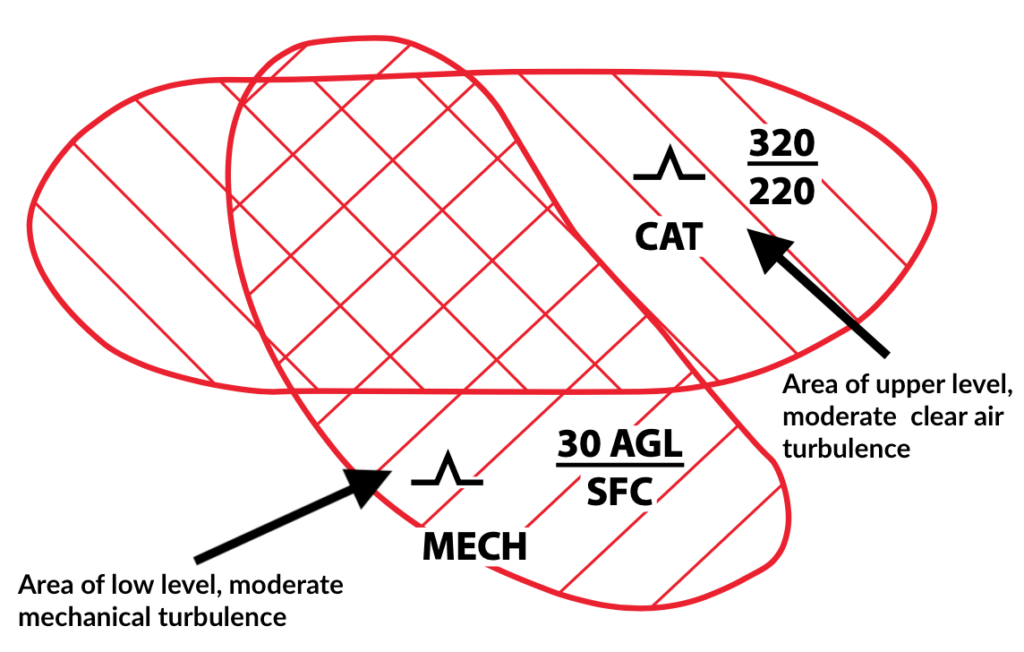
Turbulence is depicted in red whenever moderate ![]() or severe
or severe ![]() turbulence is forecast for the coverage area. Severe turbulence is depicted with a higher density of hatching than areas of moderate turbulence. The cause of the turbulence will also be included. When separate areas of turbulence are occurring at different altitudes, the lower level is shown with hatching that slants upward to the right, while the higher level is depicted with hatching that slants downward to the right.
turbulence is forecast for the coverage area. Severe turbulence is depicted with a higher density of hatching than areas of moderate turbulence. The cause of the turbulence will also be included. When separate areas of turbulence are occurring at different altitudes, the lower level is shown with hatching that slants upward to the right, while the higher level is depicted with hatching that slants downward to the right.
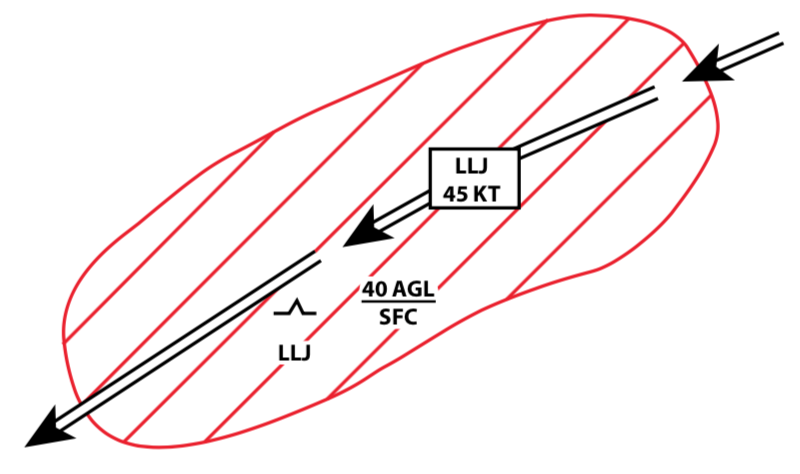
The presence of low-level jets (LLJs) are depicted on the GFA icing, turbulence and freezing level chart when it is expected to have a peak core speed of 50 knots or more, however, it may be included at speeds between 35 and 45 knots when significant associated turbulence or shear is expected.